
When I was actively searching to buy a home in El Segundo I dug deep into the historical sales. I wanted to know if I bought a home near the “top of the bubble” (this was summer 2015) what was my potential downside. For me buying a home that fit our family needs at a fair price, and at a monthly cost I could afford even if the economy went sideways was a no-lose proposition, even if the value of that home dropped 20-30%. Come hell or high-water it’s El Segundo or bust for my family (blame my wife). So I’m not going to die if the “value” of my home drops assuming I’m here for another 15-30 years so what does it matter as long as my monthly cash flow figure stays within my comfort zone?
I stopped tracking this data after I threw in the towel on our search to buy but it helps to take a look at history. The data set is probably shit. It’s from Redfin, hardly scientific and because Redfin changed the format of the data I had to look up and input some of the data by hand. The data is only based on single family homes sold in El Segundo.
Averages are an ugly number to look at. For example, 225 W Sycamore 90245 sold for $80,000 in June 2017. Yes, no misprint, $80k. You didn’t get an invite to the broker’s open either? But we all know that was shady tax avoidance flipping strategy. But when you throw a number like that into the mix it skews things quite a bit. I also tend to look at price per square foot which isn’t an apples to apples comparison. A bigger house typically goes for a lower price per square foot. Tiny 1000sqft homes are going for $1000/sqft while homes for people that don’t want to co-sleep with teenagers are in the $600/sqft range.
I looked at this data to get an idea where I wanted to pay for a home as well as the potential downside. If you are buying at the top of the market, and over-extending yourself on a cash flow basis there’s a potential for a financial disaster.
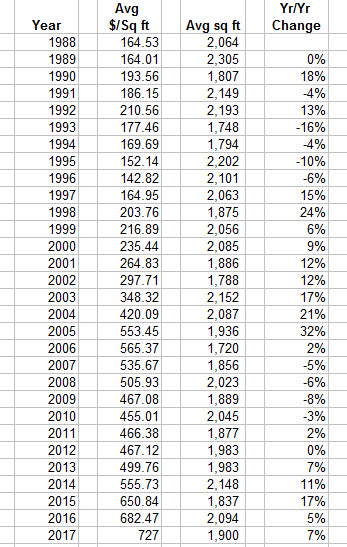
Price per square foot. In 2004 El Segundo was at an average of $420/sqft. At the peak in 2006 it bumped up to $565, a 35% increase in four years. From peak to trough in 2010 back down to $455/sqft down -19%. But then it gets crazy. 5-17% increases in price per square foot per year bring us to today’s bat-shit crazy $727/sqft up 73% since 2004. And today you have people chasing homes priced at $1000/sqft. That’s 38% over the average!
Bubble? What bubble? $1000/square foot is totally reasonable. “They’re not making any more land west of Sepulveda”

What is the ‘Mean Reversion’
